A tide chart is useful only when its location, date, time zone and height reference match the question you are asking. Start with those four details before choosing an outing time.
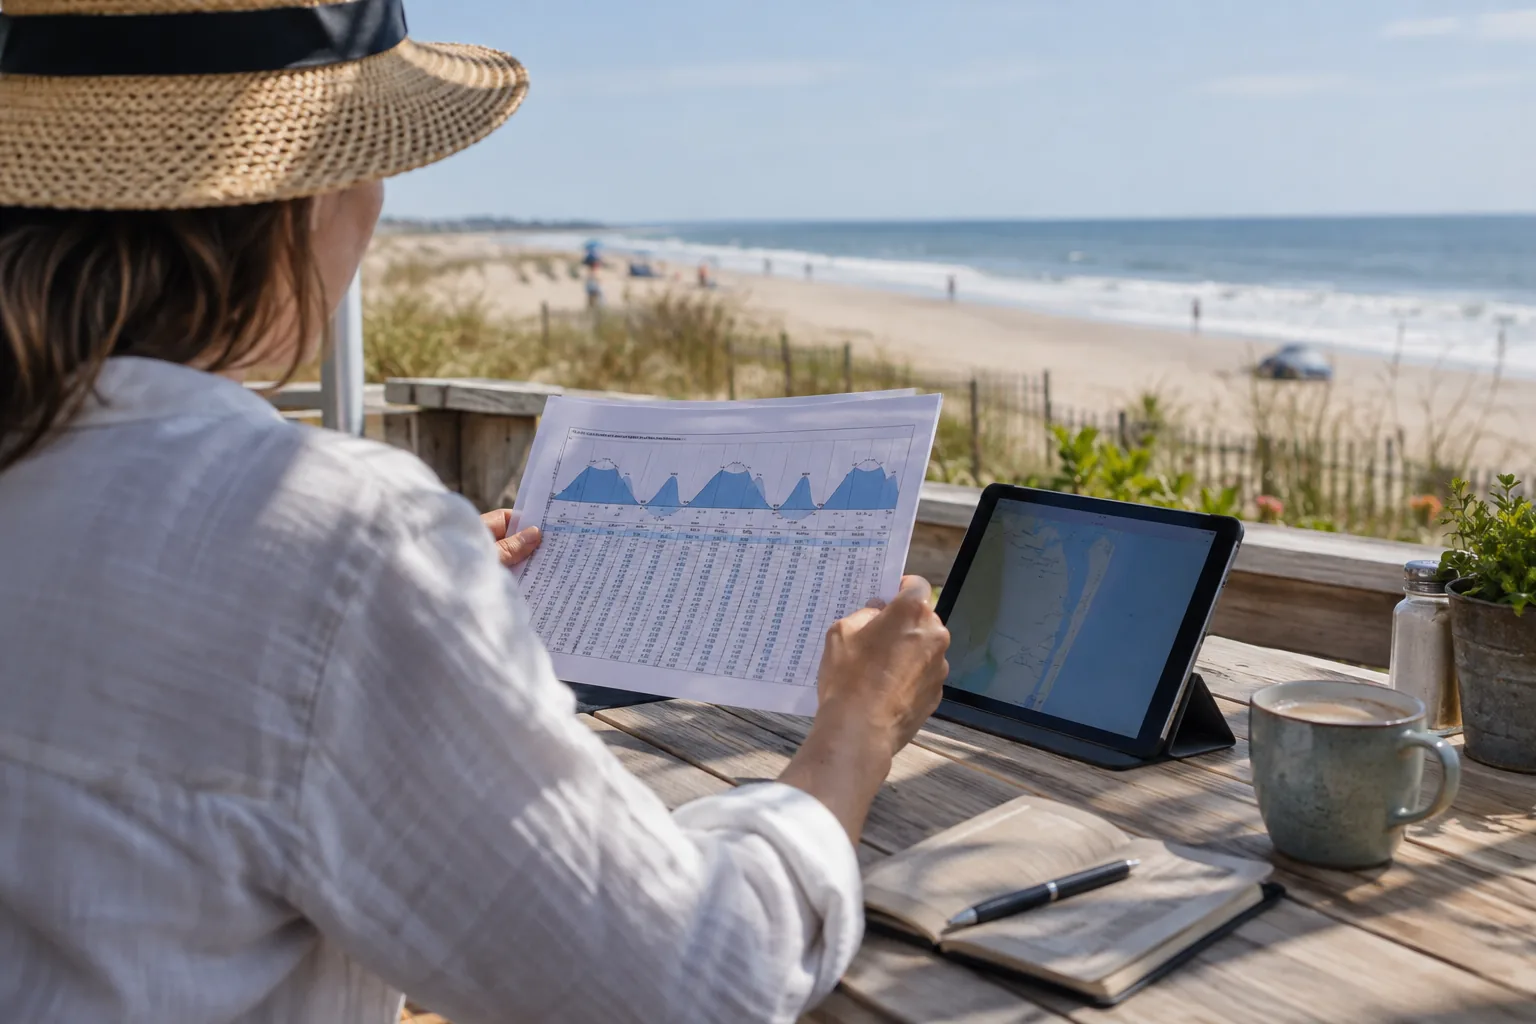
Read one event from left to right
In our Ocean City Inlet table, read the local calendar date first, then the time labelled EST or EDT, the high or low event, and the height in feet MLLW. High means a predicted maximum in water level; low means a predicted minimum. The event label is not a description of wave size or current speed.
What MLLW means
Mean Lower Low Water is a reference level used to describe water heights. The height is not the distance between the water surface and the bottom at your destination. A negative predicted height means below this reference, not an absence of water everywhere.
For example, a hypothetical 2.50-foot high and 0.30-foot low have a 2.20-foot predicted difference. That subtraction compares two levels; it does not produce a channel-depth or boat-clearance assessment.
Common reading mistakes
| Mistake | Better check |
|---|---|
| Using a pier name for an inlet station | Match both the station number and official station name. |
| Treating an evening event as the next morning | Read the calendar date alongside every time. |
| Adding a fixed daily time shift | Look up the next day’s actual prediction. |
| Calling low water slack current | Use appropriate current information; turning water level and turning current differ. |
| Using a tide table as a beach safety notice | Check local instructions and weather separately. |
Compare locations carefully
Our table uses station 8570283, Ocean City Inlet. NOAA identifies 8570280 as Ocean City Fishing Pier; these are different stations. Bay-side locations can also need their own predictions. See the inlet-versus-bay guide before applying one location’s time to another.
Turn the chart into a plan
- Record the destination, date and selected event.
- Write the datum and units if comparing another source.
- Check beach conditions or navigation information for your activity.
- Check again before departure rather than relying on an old screenshot.
Source
NOAA tide predictions supply the table. NOAA’s tide and current questions explain why prediction levels, observations and currents serve different purposes.
Continue planning
For a current chart with a date selector, use the main Ocean City MD tide chart. The water-temperature observation is a separate measured product and cannot be read from the tide height column.